See where money sticks.

You already draw these levels. Every morning. Across multiple timeframes. Manually. This does it in real-time so you don't have to.

Subscribe
$299/mo indicator — $999/mo custom consulting
The thing nobody else has
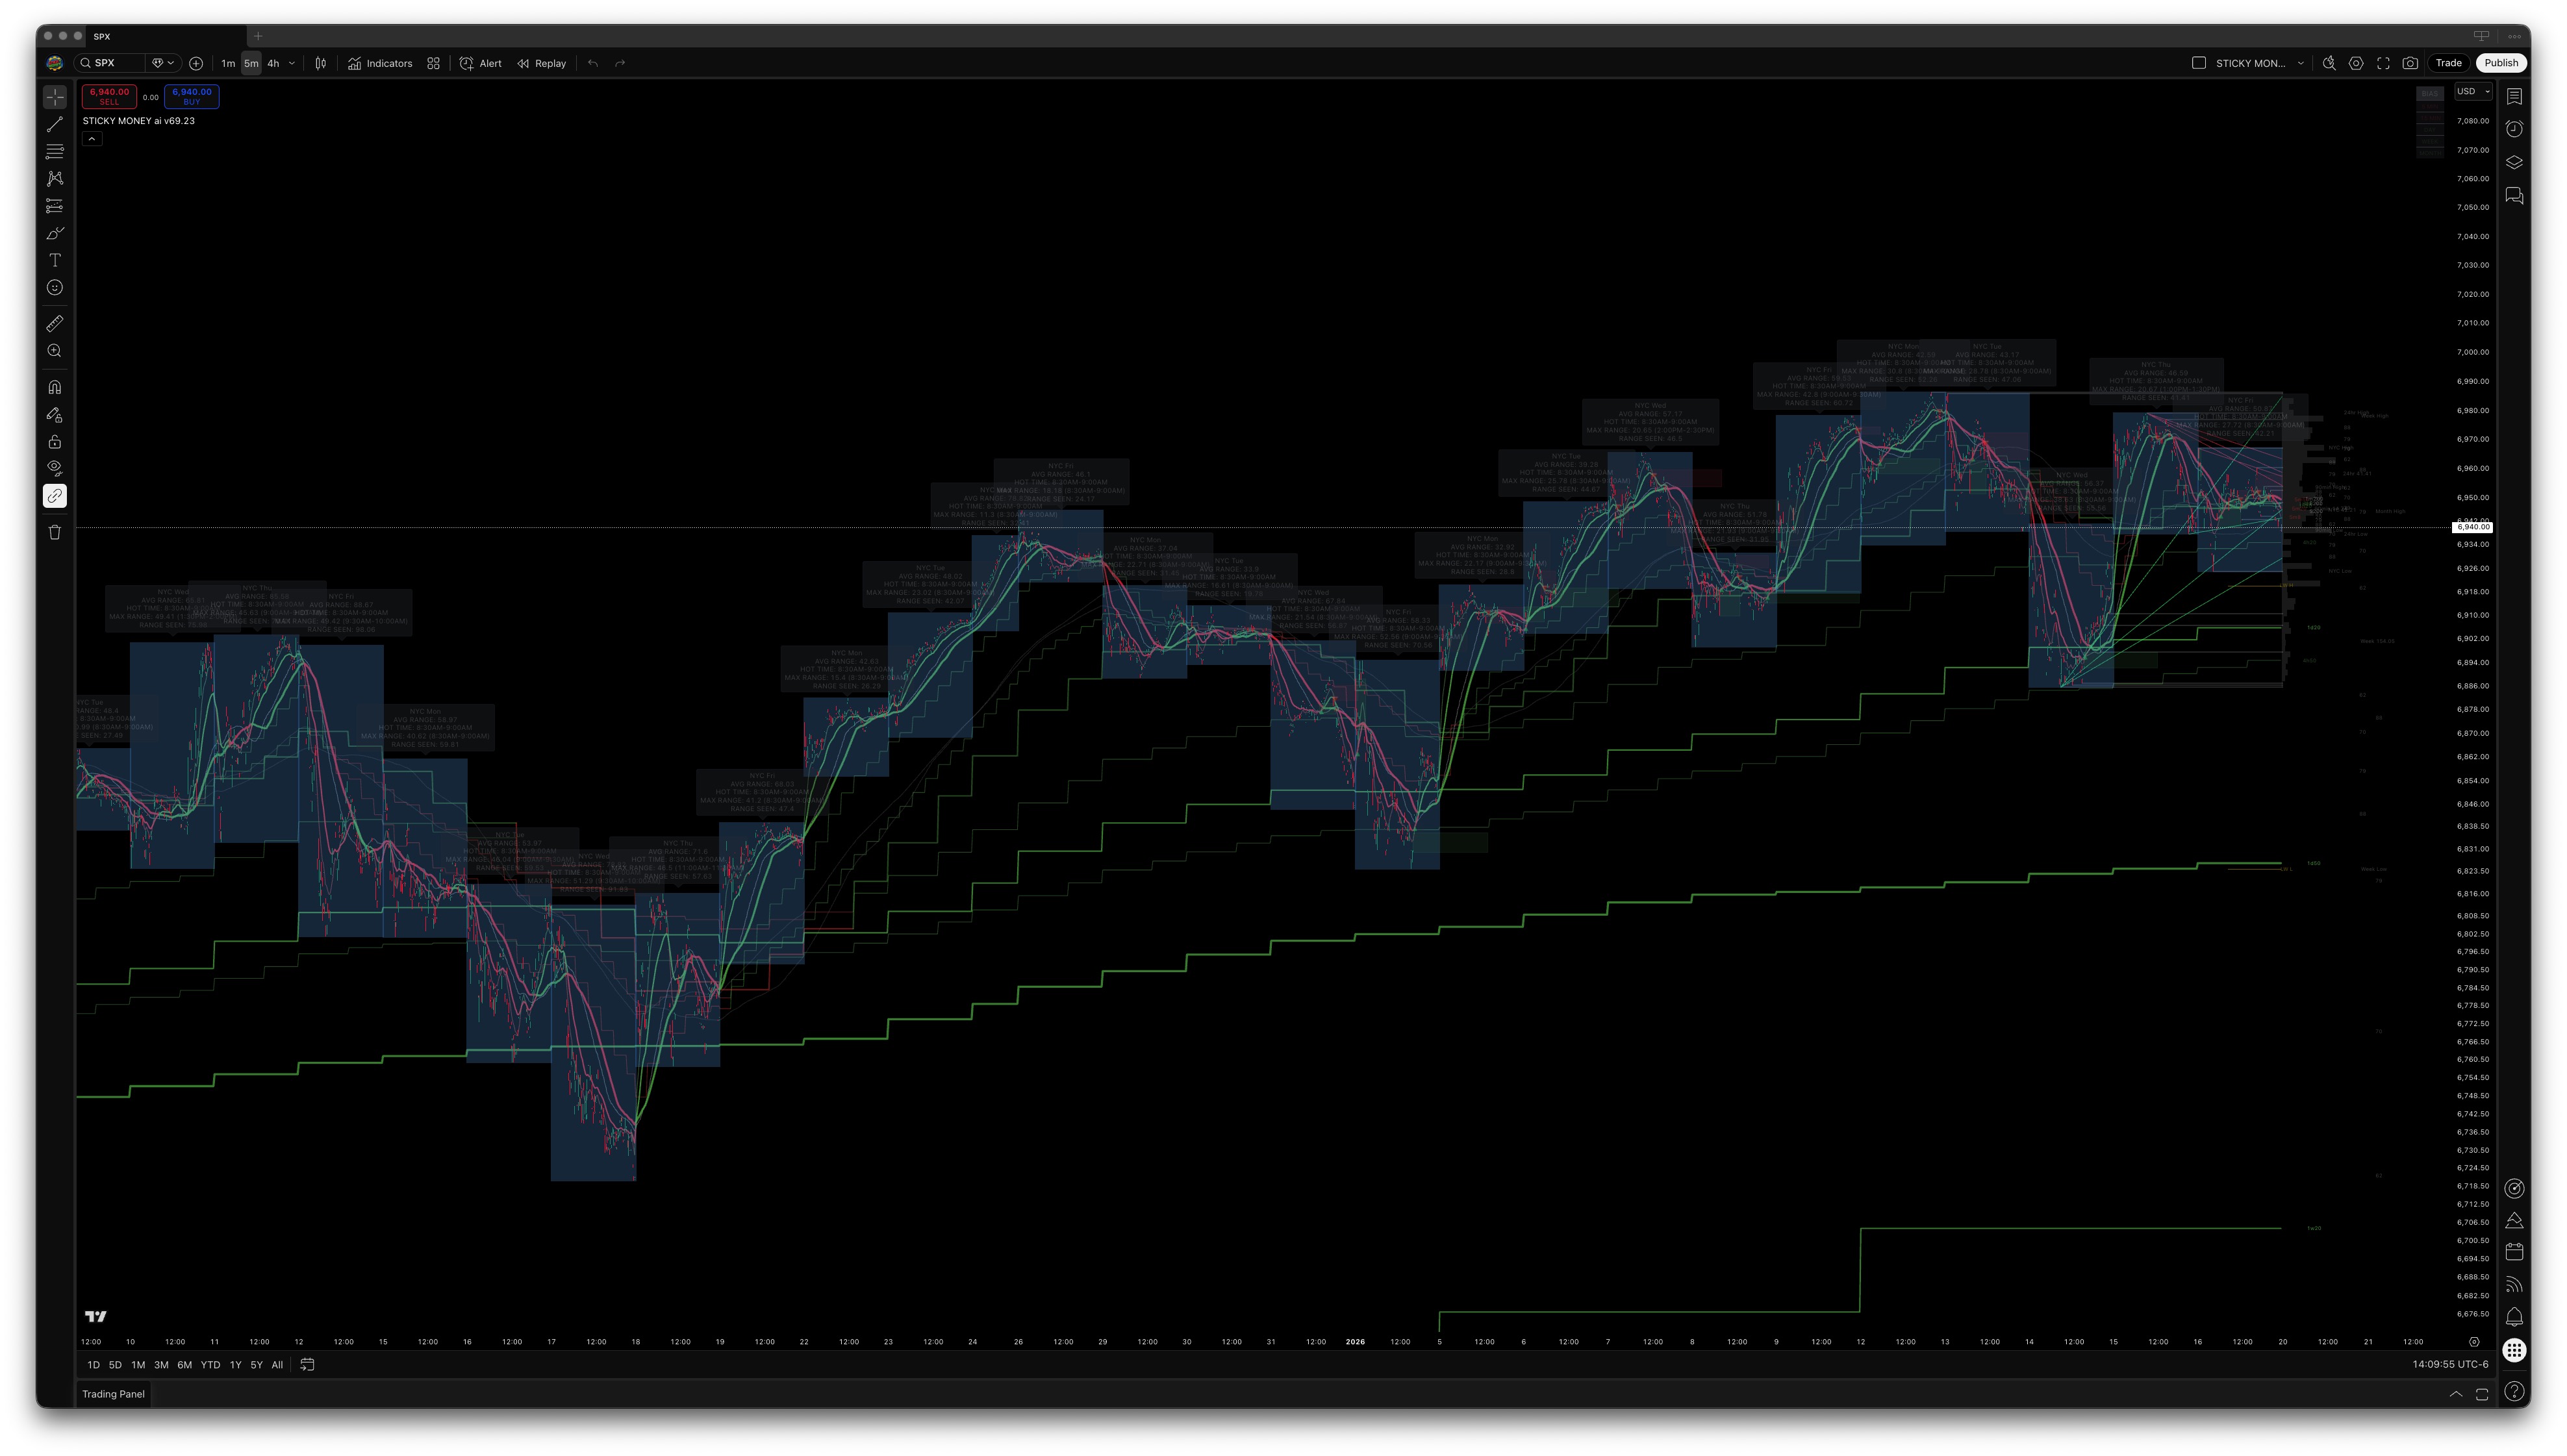
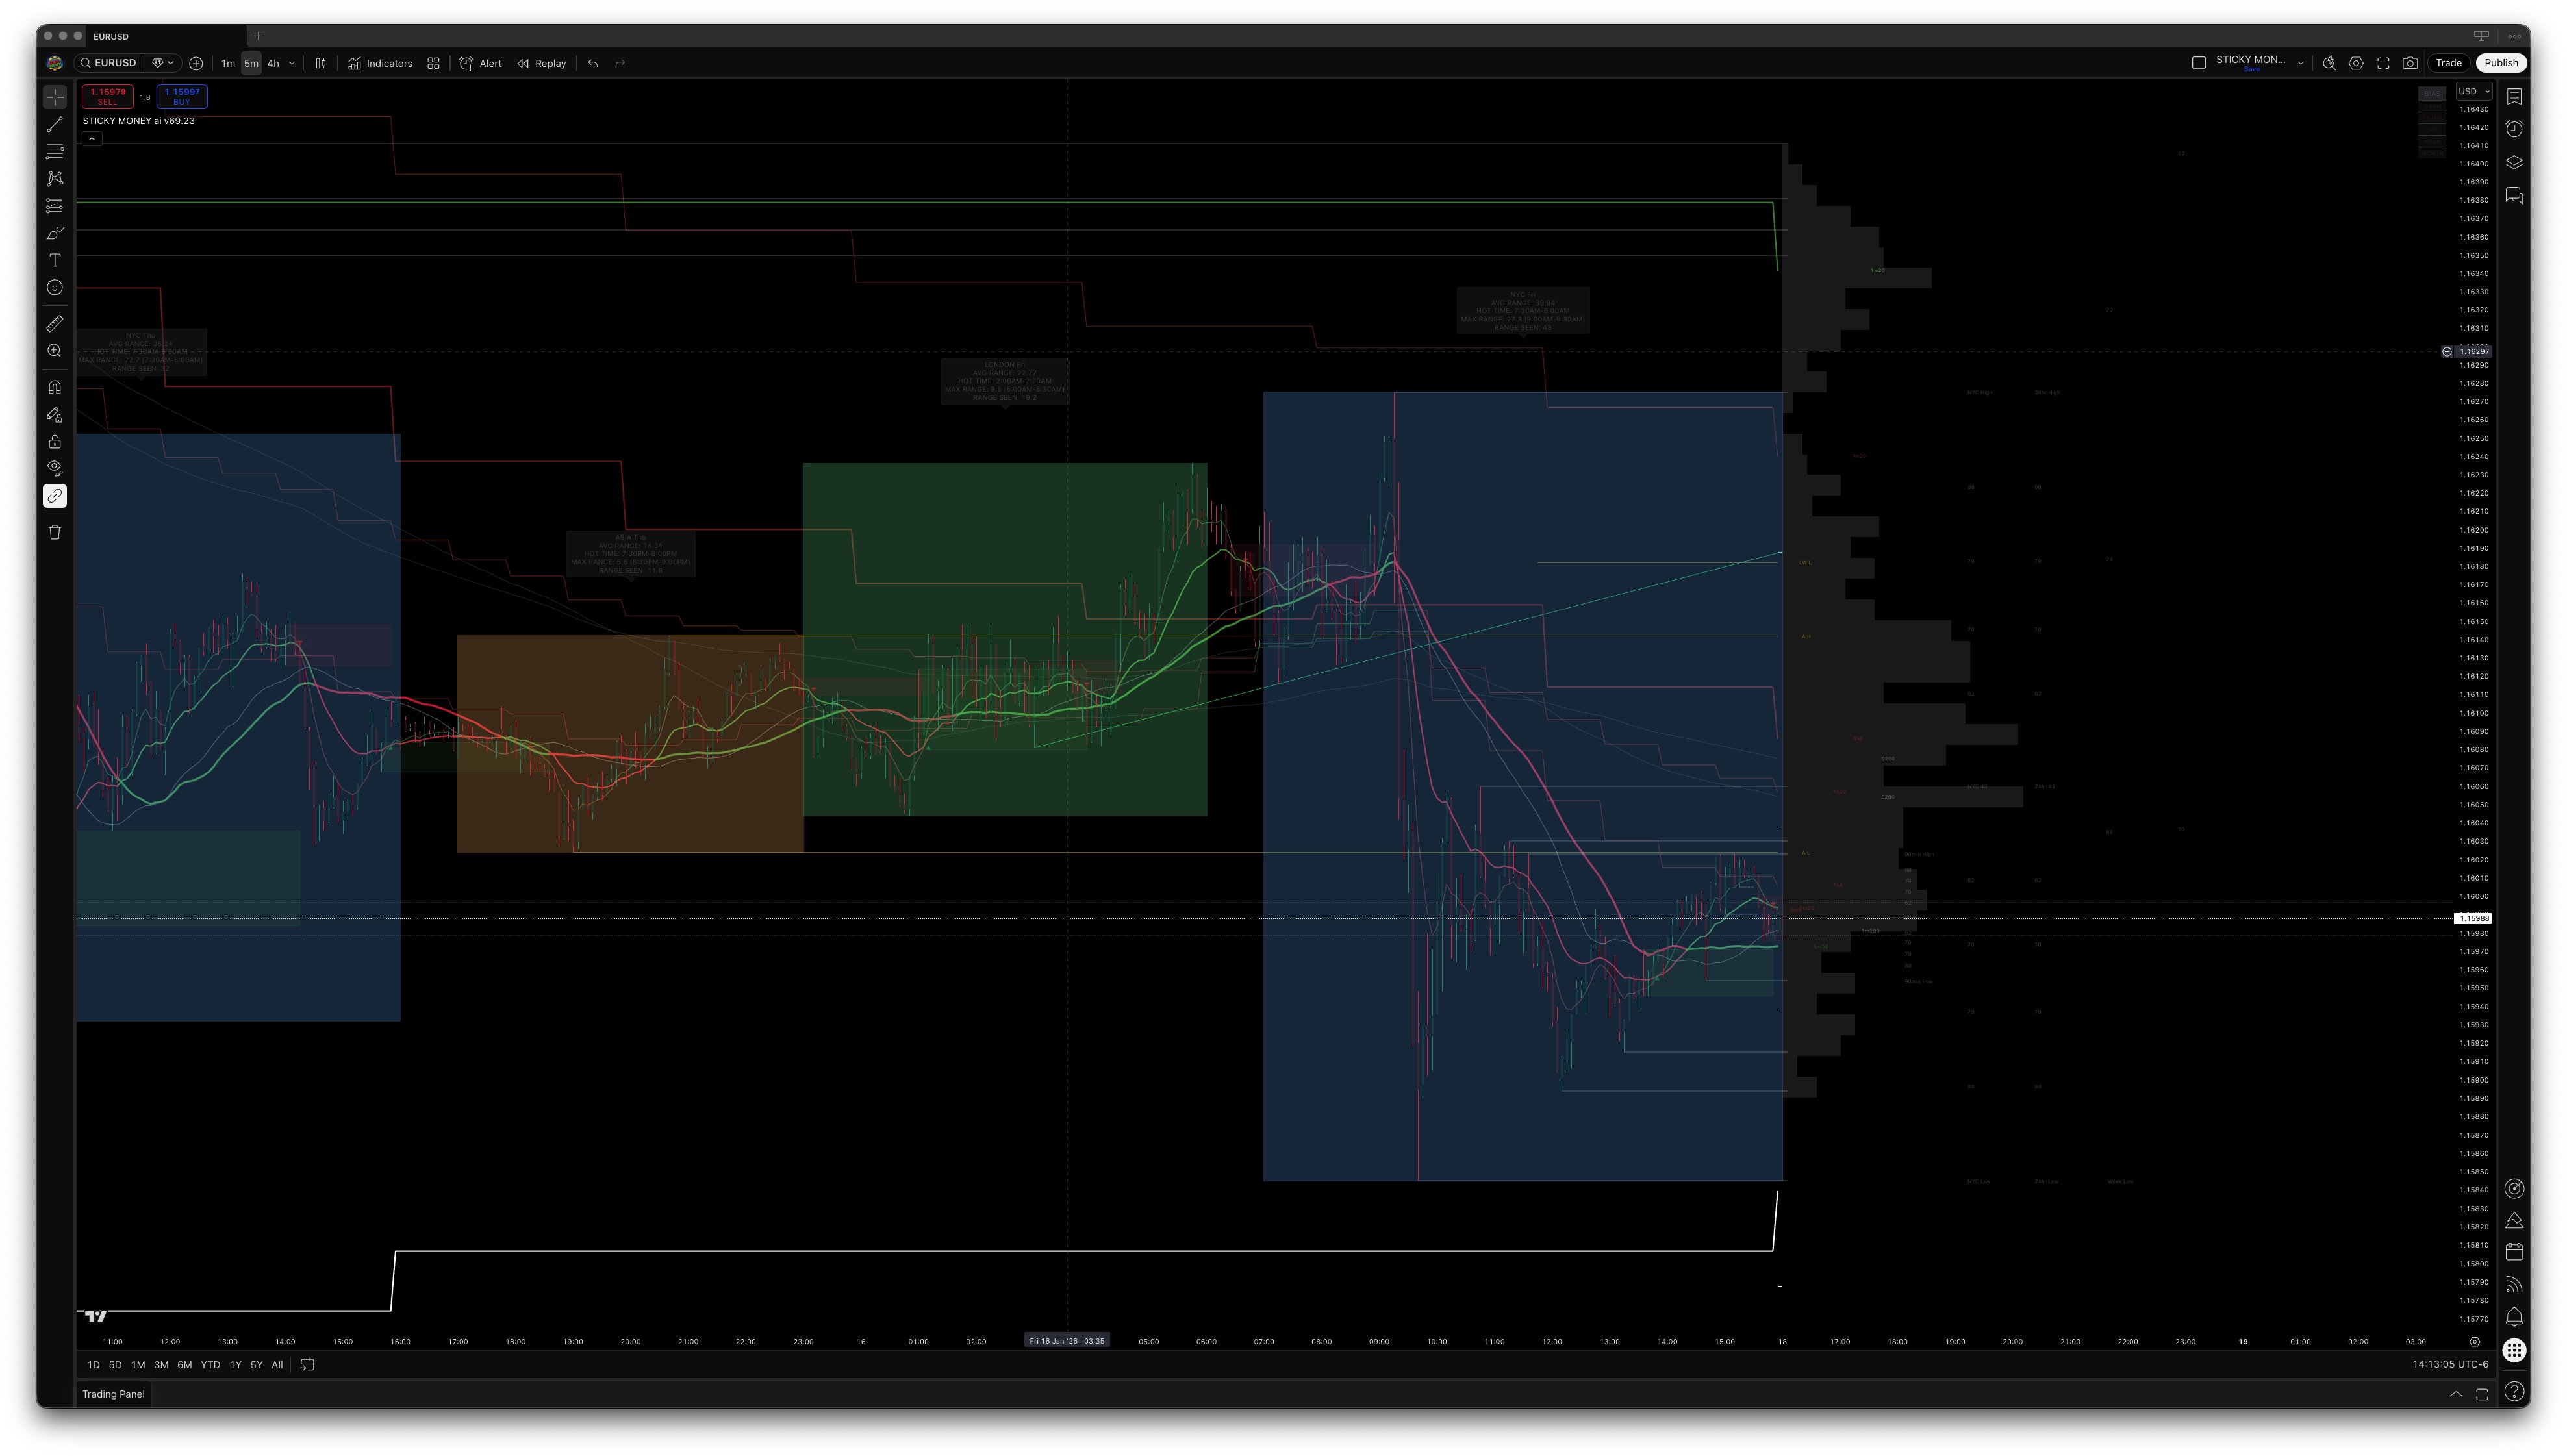
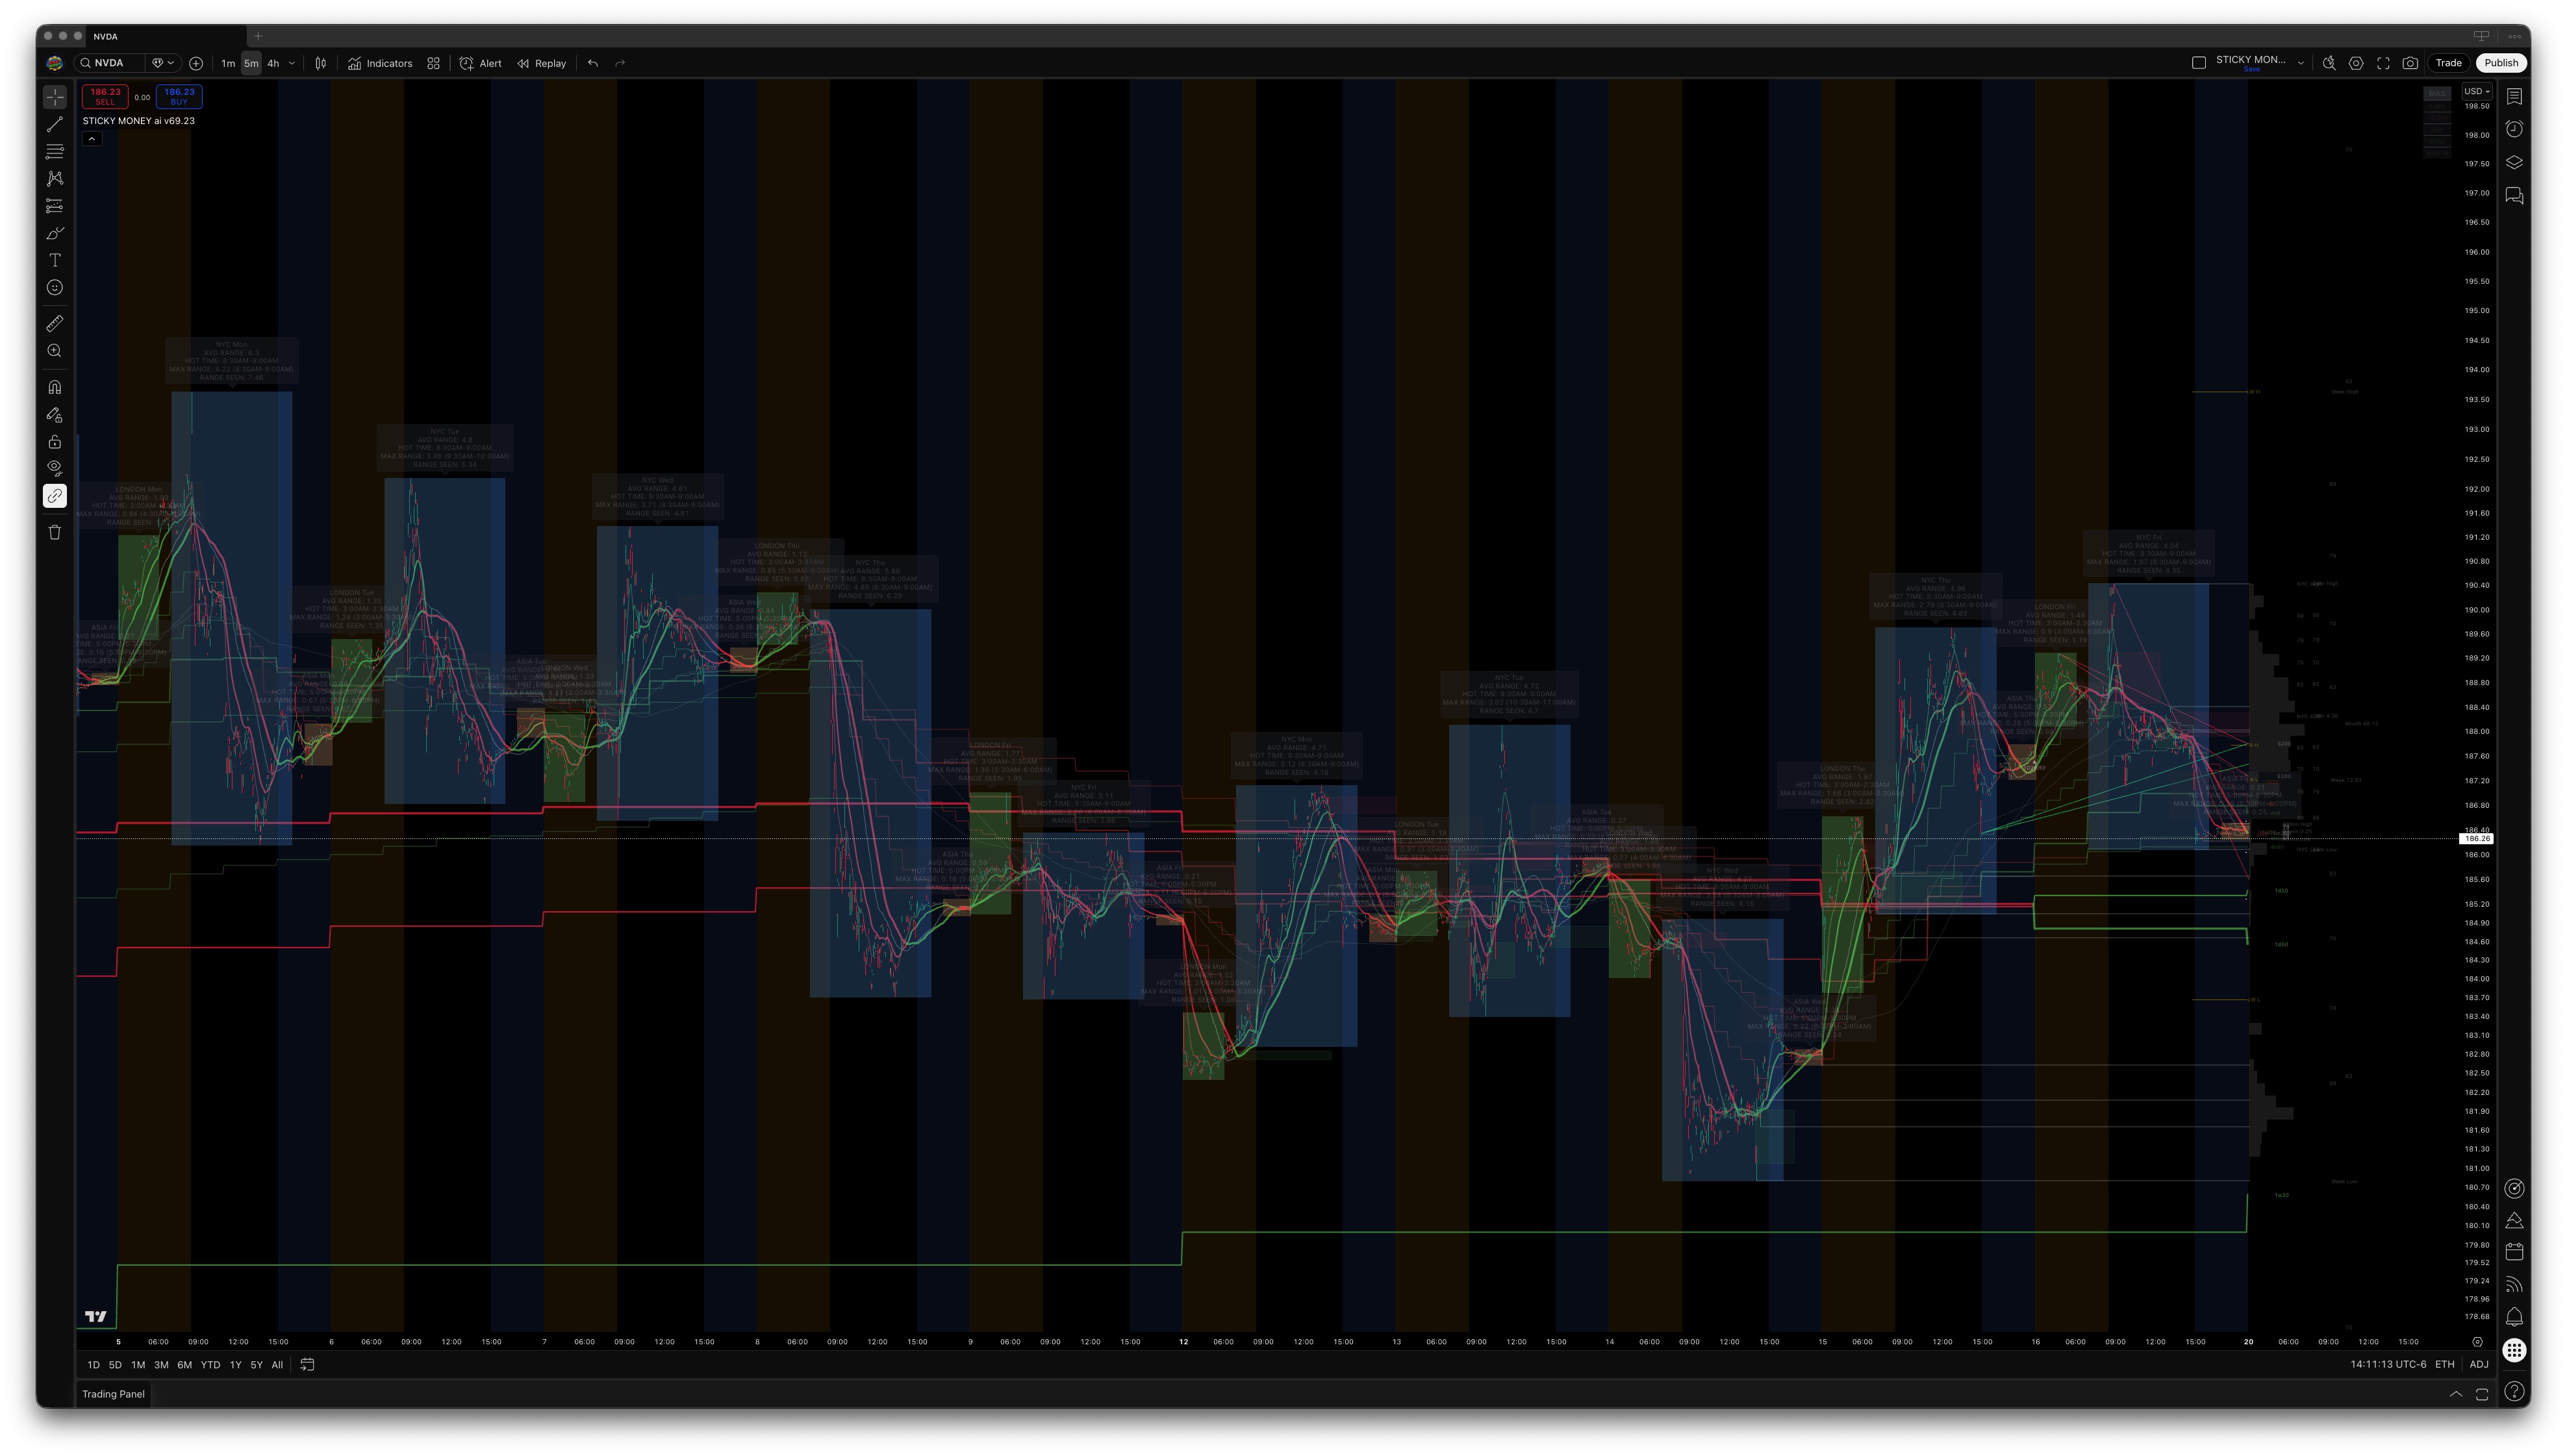
Probability Zones

Six independent analysis categories scored at every price. Where they agree, price tends to react.

Probability zones on XAUUSD — colored boxes with percentage scores where independent analysis types agree

Where levels agree

When a weekly moving average, a fibonacci retracement, and a session boundary all land at the same price — the zone lights up. The more categories that agree, the higher the score.

Historical zones persist across NYC sessions. Scroll back and see where they called moves before they happened.

Maximum score is 86%. The seventh category is the thing you can't quantify. If someone tells you they're 100% sure, they're selling you something.
How it works

The levels that move price — all on one chart

Levels stacking up on SPX

Where levels stack up

A weekly moving average, a fibonacci level, and a session boundary land at the same price. That cluster lights up as a probability zone. The score tells you how many independent categories agree — no guesswork.

Where trading actually happened

Five forex volume feeds aggregated into a volume profile. Price slows at thick zones and moves fast through thin ones. You see which is which before you enter.

Volume profile on EURUSD
Session telemetry on NVDA

When sessions move

Each session tracks its own history. You see the 30-minute window where volatility peaks, the average daily range, and the largest move with timestamps. Structure, not noise.

What's on your chart

Everything in one overlay

Toggle what you need. Everything else stays out of the way.

Probability Zones

Six categories scored at every price. Heat-mapped from blue (29%) to gold (86%). Historical zones persist across sessions.

Moving Averages

1-minute through monthly. Color-coded by timeframe so you see which ones agree on direction and which don't.

Session Structure

London, New York, Asian. Per-day average range, 30-minute hot window, largest intraday move with timestamps.

Volume Profile

Five forex volume feeds aggregated at price, not time. Where the most trading actually happened.

Fibonacci

Levels price keeps returning to — from 90-minute, daily, weekly, and monthly ranges.

Bias Dashboard

Are timeframes pointing the same way? Check before you lay your money on the table.

Fractal Support

Swing points that held — extending as lines until price breaks through.

Trendlines

Drawn automatically from confirmed pivots. Only the strongest lines appear.

Momentum Compression

Detects when price is coiling. Tight range + declining volume = something is about to break.

40/40
security() calls
7
timeframes
5
volume feeds
6
analysis categories
Pine v6
TradingView
All
asset classes

$299/mo

Everything you'd draw manually, done in real-time across every timeframe you'd check.

Subscribe $999/mo Consulting